Do Domain Sales Actually Match Appraisals? A 10-Year Data Study
Last time, we wrote about what a good sale actually looks like: an appraisal is a retail range, not a target, and real sales land around it, not on it. Fair enough, you might say, but how far around it?
To answer that empirical question, we turned to the hardest data we could find: a decade of DNJournal's year-end charts.
The Experiment
DNJournal has published a year-end chart of the biggest reported domain sales for decades. We took ten full years of those top-100 charts - 1,217 sales in all, from six-figure brandables to eight-figure one-worders - and appraised every domain with our current engine (Engine v2.5).
To keep single-run noise out of the result, each domain was appraised five times independently, and we used the consensus of those runs. Then we asked one question per sale: Where did the actual price land relative to our appraisal range?
We made two adjustments, both of which we would want applied to us if we were being tested:
- Inflation and market growth. A $500,000 sale in 2016 is not a $500,000 sale today, in either purchasing power or domain-market terms. We brought every price forward to present value using the same year-by-year adjustment we use for comparable sales on appraisal pages.
- An honest band, not a bullseye. We scored each sale against a band stretching from a priced-to-start floor (20% of our range low) up to a moonshot ceiling (2x our range high). A skeptic might ask, Why such a wide target? Because domain names are hyper-illiquid assets with extreme bid/ask spreads. This wide band doesn't reflect a lack of precision; it reflects the reality of buyer intent. Wholesale liquidity deals clear low, while motivated end-users pay massive premiums.
The Result
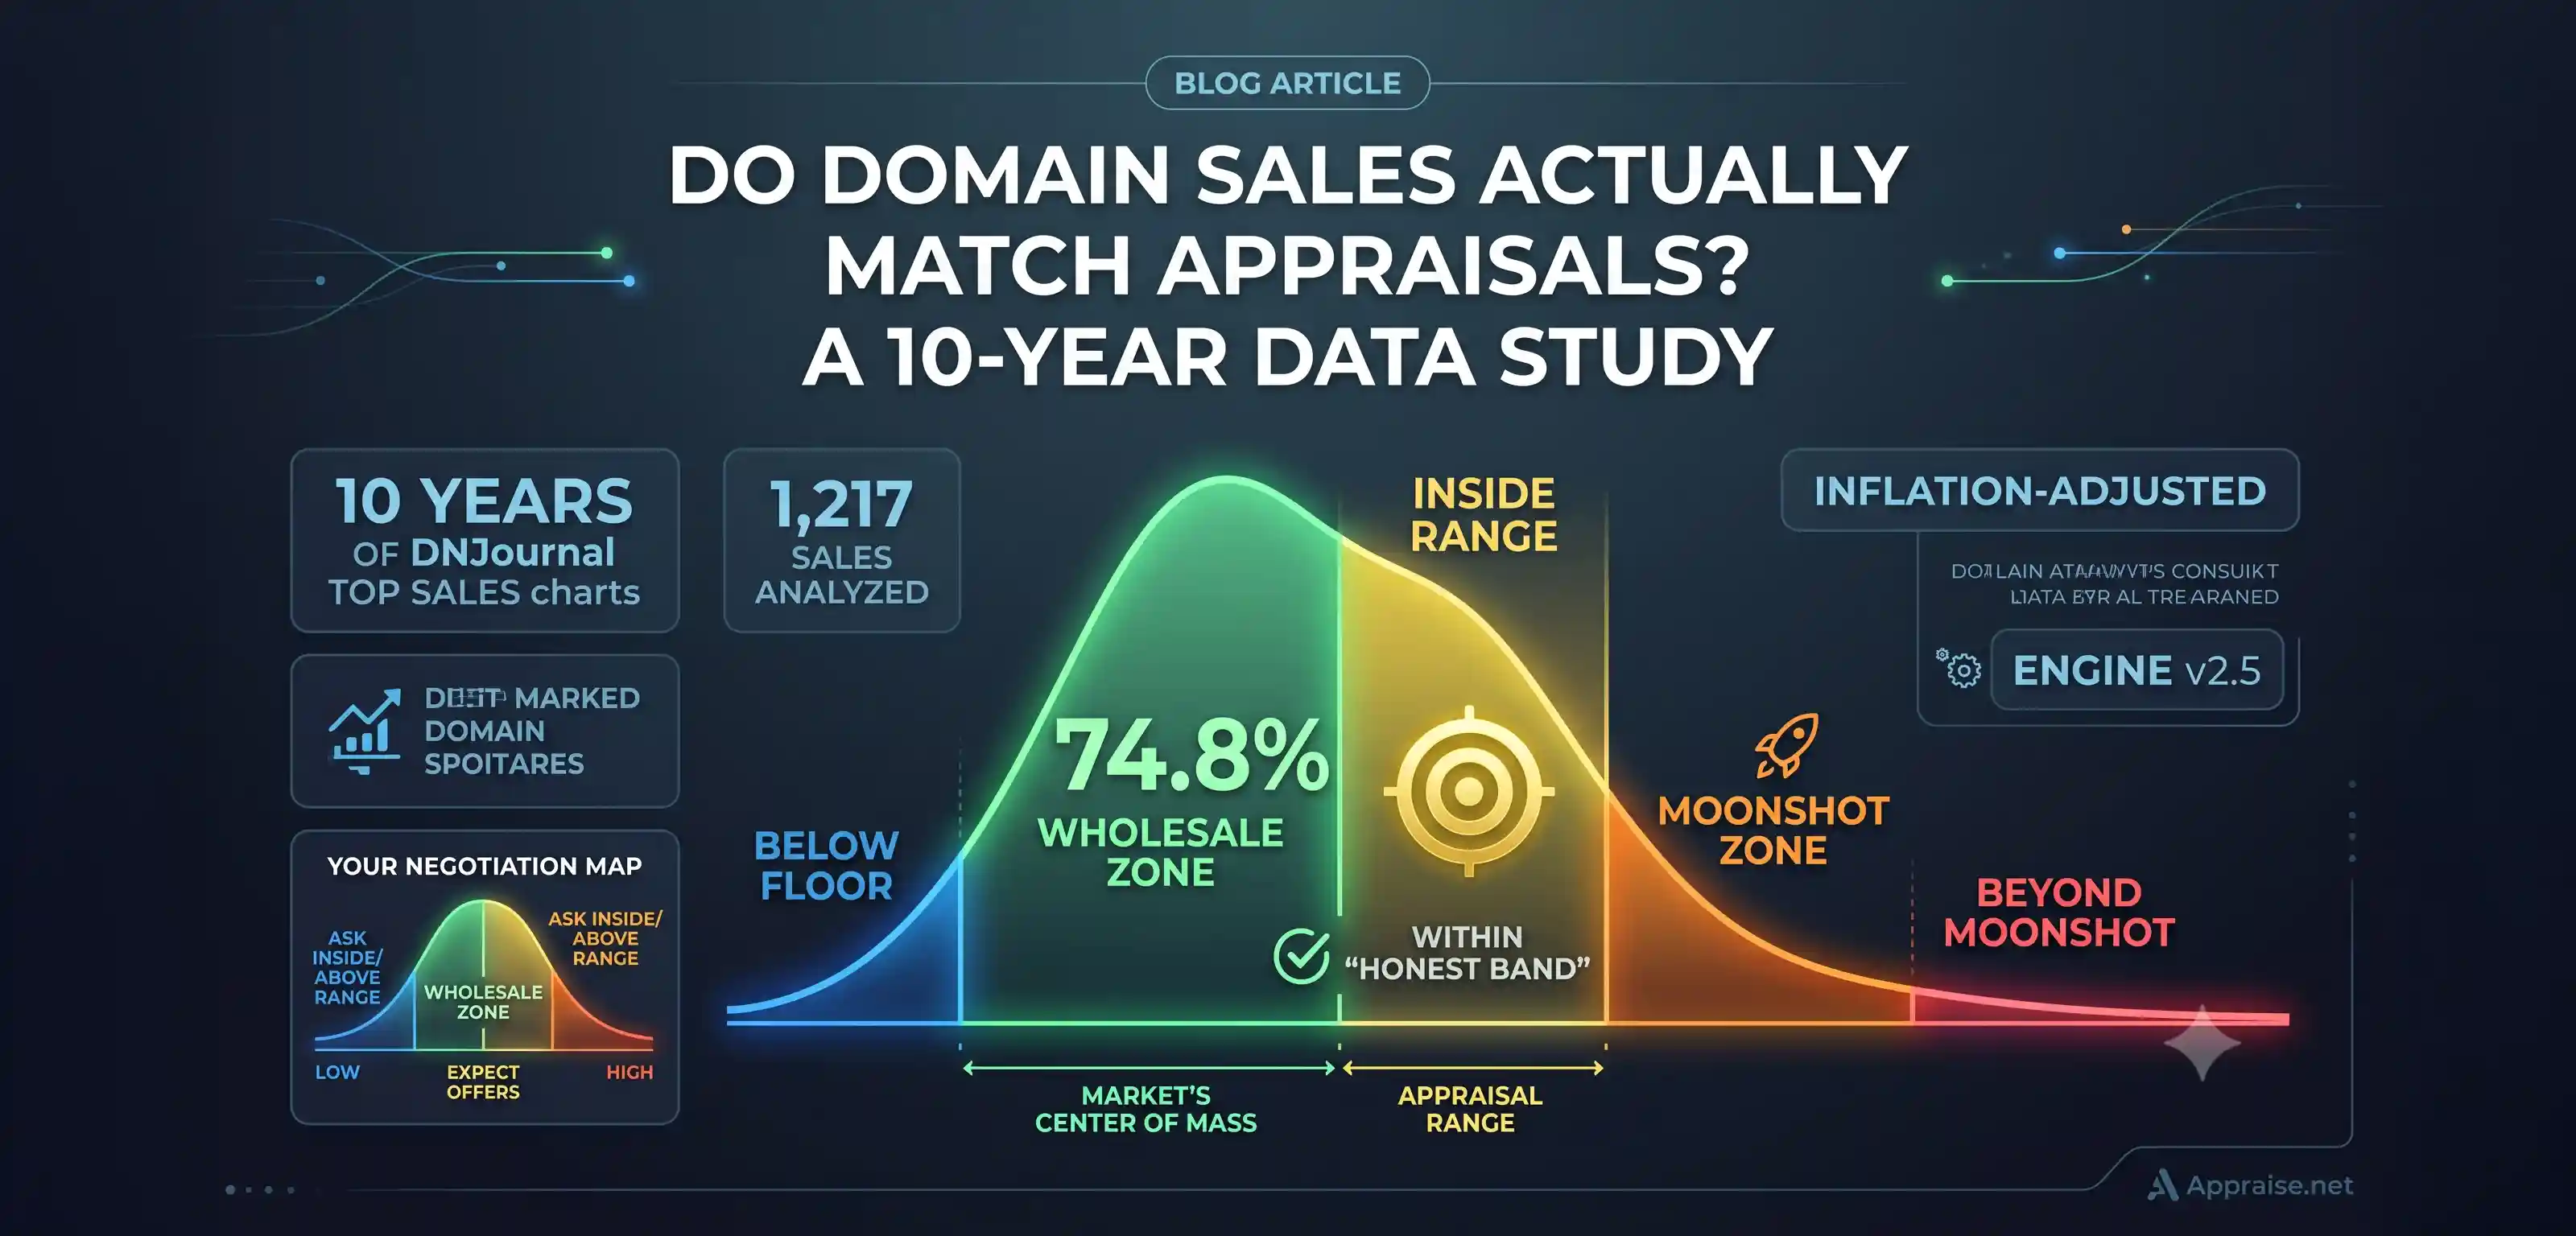
74.8% of ten years of top-chart sales transacted inside that band. Here is the full distribution, adjusted for inflation and market growth:
| Where the sale landed | Definition | Share of 1,217 sales |
|---|---|---|
| Below Floor | Under 20% of range low | 18.1% |
| Wholesale Zone | 20% up to the range low | 48.6% |
| Inside Range | The appraisal range | 11.8% |
| Moonshot Zone | 1x to 2x the range high | 14.4% |
| Beyond Moonshot | Over 2x the range high | 7.1% |
Read the Wholesale Zone row again, because it is the real finding. The market's center of mass sits firmly in the wholesale half of the band.
Since these are DNJournal top-100 sales - the most premium, celebrated sales of the year - you might assume they would skew heavily into "moonshot" territory. The fact that nearly half of them cleared below the retail range is striking. It suggests even the best domains in the world frequently sell at wholesale rather than to end-users at full retail.
One more thing worth remembering when you read that skew, because it is a known fact of this industry: most retail sales are never reported at all. End-user deals routinely close under NDA, and a company that just bought its brand name has every reason to keep the price quiet. What reliably reaches the public record are marketplace and auction results, which skew wholesale. So the visible market, even at DNJournal's level, undercounts exactly the quiet retail wins an appraisal range describes. If anything, the true distribution sits higher in the band than the reported one.
The appraisal range works as the market's ceiling anchor; clearing prices distribute downward from it, with a meaningful tail of buyers paying above it.
What the Band Means When You Price
If you hold a domain worth keeping, this distribution is your negotiation map:
- Ask inside or above the range. One in three sales (33.3%) closed inside or above the appraisal range. Your ask is the anchor for that outcome, and anchors set below retail never get pulled up.
- Expect most offers in the wholesale zone. Half the market clears there. An offer at 40% of your range low is not an insult; it is the statistical center of how this market transacts. Whether to take it depends on your holding costs and conviction, not on whether it "matches the appraisal."
- The moonshot tail is real, and it is patient money. Over one in five of these sales (21.5%) beat the range outright, and 7% beat double the range high. Those outcomes go to sellers who could afford to wait for the one buyer with a plan.
The Caveats, Stated Plainly
First: this corpus is selected on price. Year-end charts are by definition the sales that went spectacularly right, including the once-a-decade outliers. If anything, that stacks the deck against a band test; the everyday retail market almost certainly clears tighter around the range than its most famous outliers do.
Second: this is a market-behavior finding, not an accuracy score. We keep our accuracy claims separate and stricter - real sales matched against the range itself, documented in our accuracy gallery. This study answers a different question: across a decade of the most-watched sales on record, does the market actually transact in the wholesale-to-moonshot band around retail appraisal?
Three quarters of the time, it does.
Sales data compiled from DNJournal's published year-end top-sales charts, with thanks to Ron Jackson, whose reporting has been the industry's ledger of record for over twenty years. Prices adjusted to present value for inflation and market growth.