Why "Retail Value" Feels Wrong, and Why You Still Need It
If you run a real domain portfolio, you've probably had the same reaction to automated appraisals:
"Nice retail number, but I'll never get that. It's unrealistic, so I ignore it."
At the same time, serious investors track something most end-users never think about: Sell Through Rate (STR) — the percentage of your portfolio that sells in a year. Across blogs and forum analyses, typical reported STRs for investor portfolios are often well under 2% per year, and many sit comfortably below 1%, depending on quality and pricing.
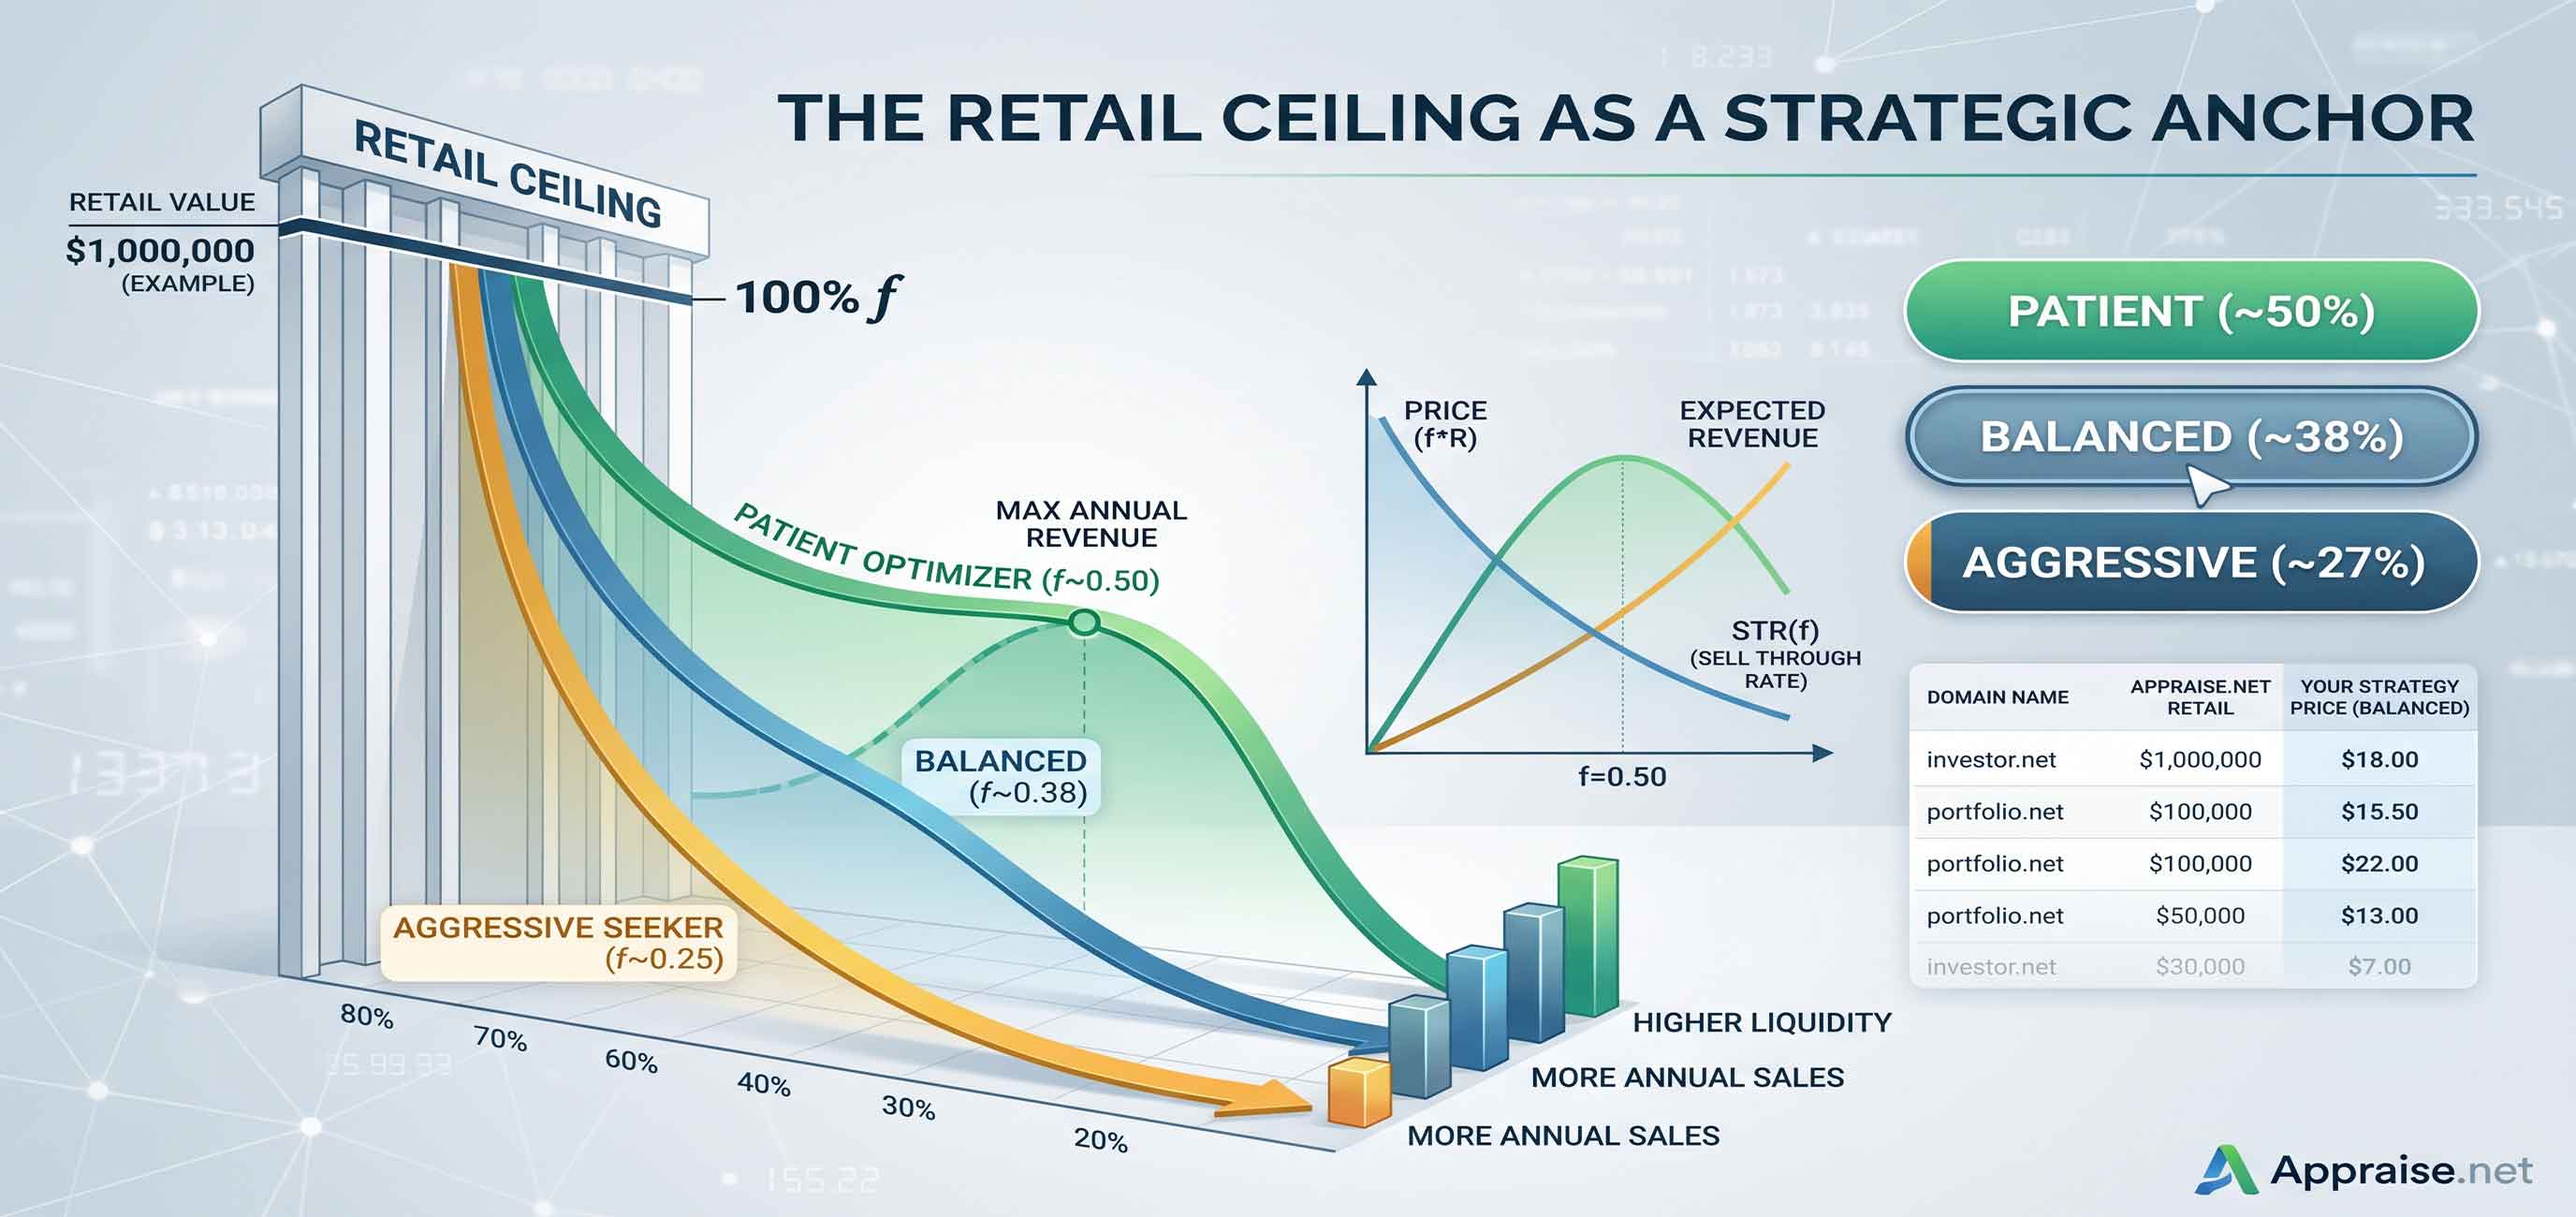
Put those two facts together and of course very few domains ever sell at a theoretical "retail ceiling." That doesn't mean the ceiling is useless. It just means you shouldn't read "retail value" as "what I will get," but as the reference price you discount from when you choose your portfolio strategy.
Appraise.net's role is to give you that ceiling in a consistent, model-driven way, and then help you decide how far below it to price, based on your risk tolerance, liquidity needs, and psychology.
Retail as a Fair Value Ceiling, Not a Promise
On Appraise.net, each domain gets an estimated retail value — the price an ideal, well-funded end-user might rationally pay in a one-off, patient negotiation. Think of it like a fair value estimate for an illiquid asset:
- It's a ceiling, not a median sale price.
- Most actual sales will happen somewhere below that number.
- Your job as an investor is to decide the haircut you're willing to take to convert inventory into cash at a given speed.
Once you treat retail as a ceiling, the right question is no longer "Is this exact dollar amount realistic?" but:
"Given this ceiling, at what fraction of retail do I want to list this domain (or this portfolio) to balance price, probability, and time?"
Mathematically, if a domain's retail value is R and you list it at a fraction f, your price is:
P = f × RThe interesting function isn't R — it's the relationship between f and your sell-through rate and revenue.
From STR as a Statistic to STR as a Function of Price
Most public discussions treat STR as a historical statistic:
STR = sales over 12 months / portfolio sizeThat's useful, but it's backward-looking. You know your STR at the prices you used last year, but not how STR changes as you move your pricing up or down the curve.
In practice, for each fraction of retail f (100%, 75%, 50%, 25%, 10%), your portfolio has a different:
- Annual probability of sale per domain at that price level (a different STR), and
- Expected revenue per domain per year, roughly:
E[revenue per year] ≈ f × R × STR(f)The whole game is understanding how STR(f) behaves: as you lower price (lower f), STR goes up, but you give up margin per sale.
You don't need perfect data to make this useful. What you need is a coherent curve that:
- Anchors at your observed STR near retail,
- Assumes STR increases as you discount,
- Lets you see where expected revenue peaks.
That's the lens Appraise.net uses internally to design default pricing strategies and STR bands, informed by known STR ranges in the industry.
The Key Insight: 50% vs 25% of Retail
Once you model STR as a function of price fraction in a conservative, realistic way, a clear pattern emerges:
- At 100% of retail, STR is tiny. You maximize revenue per sale, but you make very few sales per year.
- As you reduce price to 75%, 50%, 25% of retail, STR increases. Expected revenue per domain per year improves.
- For many plausible curves, expected revenue per domain per year peaks somewhere around 50% of retail, then begins to taper.
- At around 25% of retail, expected revenue per domain per year is meaningfully lower than the patient peak, but realized through more frequent, smaller sales.
So for a given domain with retail value R:
Listing at 50% of retail:
- Price ≈ 0.5R
- Moderate STR
- Near-max expected revenue per year
Listing at 25% of retail:
- Price ≈ 0.25R
- Higher STR
- Lower expected revenue per year, but more trades and more liquidity
This is the core idea you can actually use:
"50% of retail for patient optimizers; 25% of retail for aggressive volume seekers. The patient curve typically wins on dollars, the aggressive curve wins on velocity and psychology."
Strategy Profiles in Appraise.net: Aggressive, Balanced, Patient
Appraise.net lets subscribers define pricing strategies as a fixed fraction of retail (set "My Price (% of High Value)" directly, e.g., 40% of every domain's high estimate), or via one of three curves that vary with retail value. That's where all the theory becomes concrete.
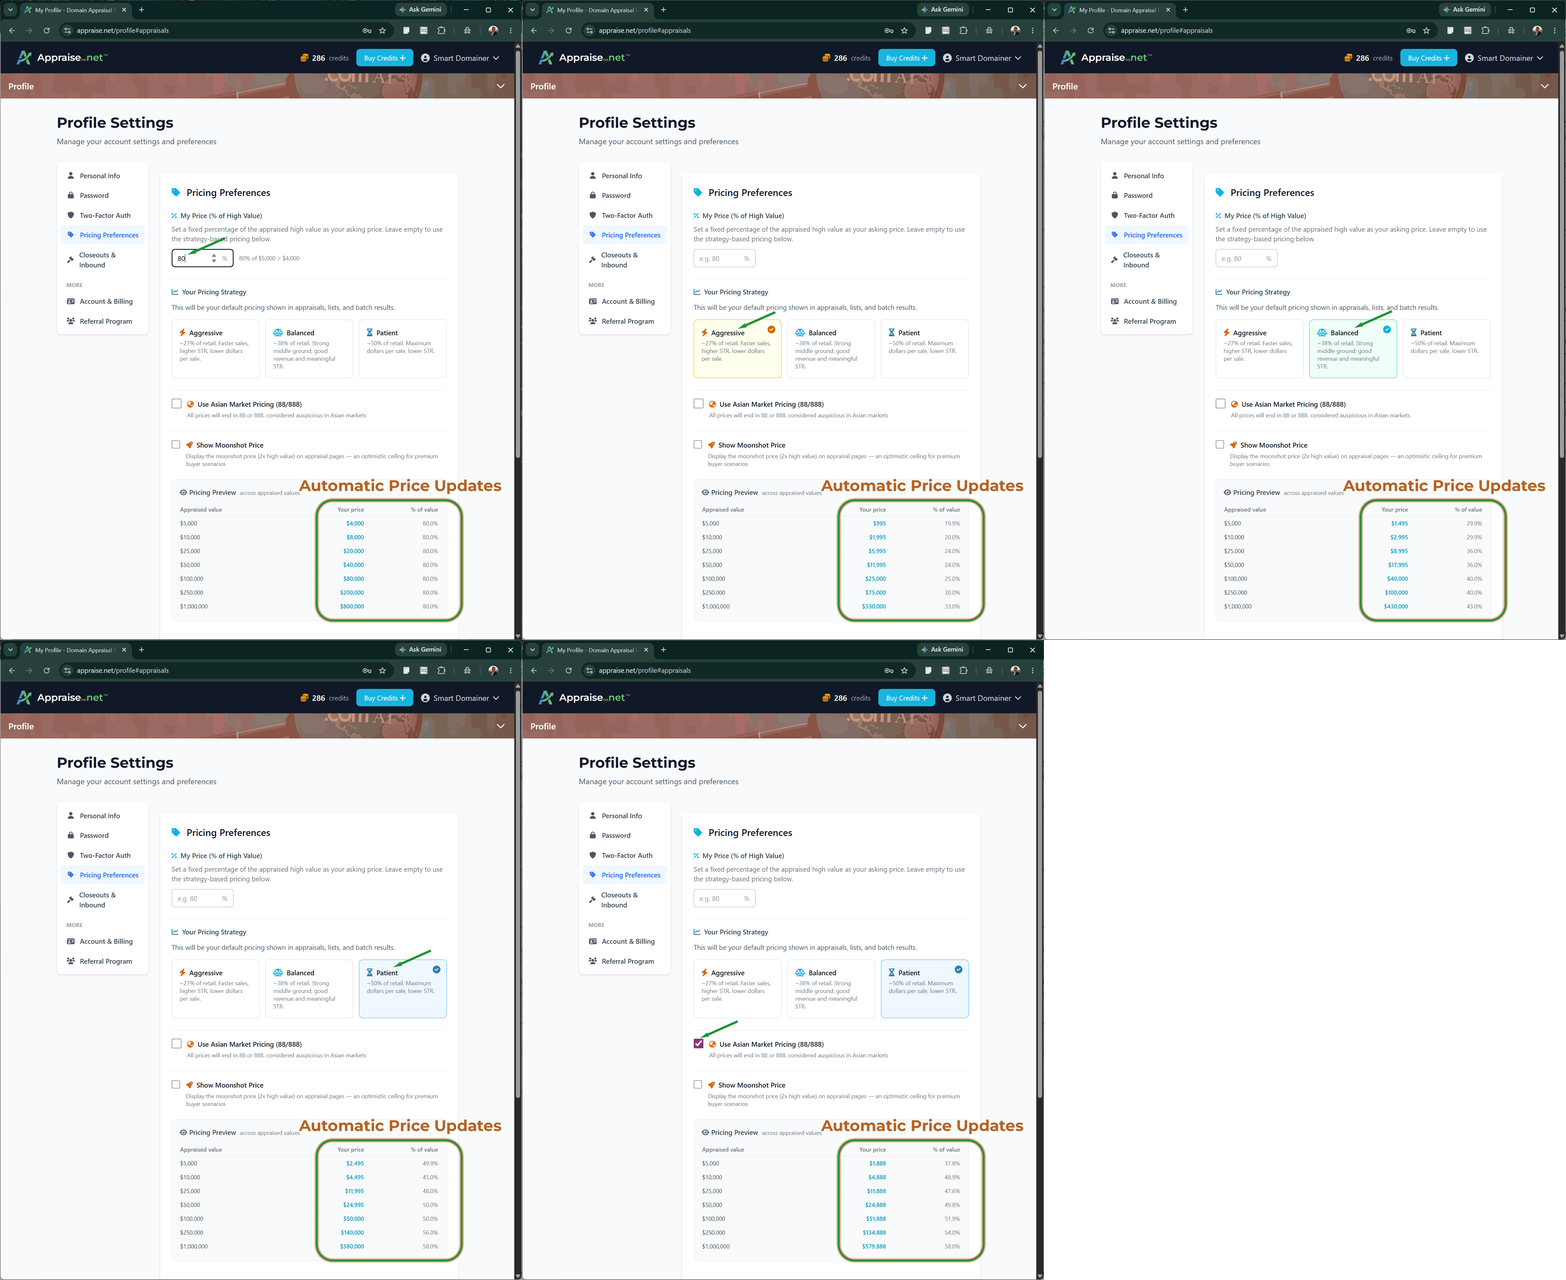
In your portfolio settings, you can choose from three preset curves that correspond to different f(R) functions:
Aggressive (around 27% of retail). f rises from 0.20 at the low end to 0.35 at the high end. List prices are around 25-30% of retail for the long tail, with a milder discount for top names. Designed to increase STR significantly: more frequent, smaller sales, with the tradeoff of lower total expected revenue.
Balanced (around 38% of retail). f rises from 0.32 to 0.45. The defensible default. Designed to capture most of the patient strategy's revenue while delivering meaningfully more sales per year.
Patient (around 50% of retail). f rises from 0.45 to 0.60. List prices cluster around 50% of retail, with a gentle curve: high-value names might be 55-60% of retail, mid-tier names around 45-50%. Designed to target near-maximum expected revenue per domain per year, with moderate STR.
Each preset is essentially a different function f(R) that maps retail values to list prices. Appraise.net computes implied STR bands and expected revenue bands for each strategy using realistic portfolio-level curves and observed industry STR ranges. If none of the three curves match how you think — say, you want a flat 80% of high across the entire portfolio — use the My Price % input at the top of Pricing Preferences and that overrides the curve.
Example: 1,000-Domain Portfolio Under Three Strategies
To see how these approaches play out at portfolio scale, consider 1,000 domains, each with an Appraise.net retail between $10,000 and $2,000,000, evenly spread across that range.
For each domain with retail R, you set a list price P = f(R) × R, where f(R) is the fraction of retail determined by your strategy and the domain's value. In all three strategies, stronger names get a higher fraction of retail and the long tail gets discounted more.
Three pricing curves
Patient strategy (~50% of retail): f rises from 0.45 at the low end to 0.60 at the high end.
Balanced strategy (~38% of retail): f rises from 0.32 to 0.45.
Aggressive strategy (~27% of retail): f rises from 0.20 to 0.35.
A realistic STR curve
Assume the portfolio's annual sell-through rate depends on the price fraction f, with diminishing returns to discounting:
STR(f) ≈ min(0.2% × (1/f)^0.8, 5%)The exponent below 1 captures a real-world fact: cutting prices increases liquidity, but each additional cut helps less than the last. A 100% retail name might sell at 0.2% per year. Halving the price doesn't quite double STR; it raises it to roughly 0.35%. The 5% cap prevents the curve from misbehaving at extreme discounts.
Results
| Strategy | Avg price as % of retail | Avg annual STR | Expected sales / yr | Expected revenue / yr | Avg sale price |
|---|---|---|---|---|---|
| Patient (~50%) | 52.5% | 0.34% | 3.4 | $1.78M | ~$530k |
| Balanced (~38%) | 38.5% | 0.43% | 4.3 | $1.68M | ~$388k |
| Aggressive (~27%) | 27.5% | 0.57% | 5.7 | $1.58M | ~$276k |
What the numbers actually say
The patient strategy generates about 13% more revenue than the aggressive one (~$1.78M vs ~$1.58M), with 40% fewer sales. The balanced strategy sits cleanly between them on every dimension.
This is the real tradeoff:
- The patient curve wins on dollars per sale and total revenue. Hero names anchor the portfolio's value, and discounting them too aggressively gives up more margin than the additional STR can recover.
- The aggressive curve wins on cash flow rhythm, faster capital recycling, and reduced holding risk on long-tail names that may never find their perfect buyer.
- The balanced curve gives you most of the patient revenue with meaningfully more sales, which is why it's a defensible default for investors who haven't decided which side they lean toward.
None of these strategies is wrong. They're solving for different things. The patient optimizer is maximizing dollars per sale and treating the portfolio like a long-dated options book. The aggressive seeker is maximizing sales per year and treating the portfolio like a working inventory that needs to turn over.
The question isn't "which strategy is correct?" It's "which tradeoff matches my goals, my time horizon, and my tolerance for sitting on inventory?"
The math is the easy part. Once you have a defensible retail anchor, picking f is a strategy decision, not an analytical one. Set it once in Pricing Preferences and every appraisal, list, and batch result on Appraise.net will use your strategy by default.
Numbers in this example come from a model assumption (STR(f) = 0.2% × (1/f)^0.8, capped at 5%). Real portfolio STR varies with name quality, TLD, channel mix, and market conditions. Use these numbers as a directional framework, not a forecast.
Appraise.net is an AI-powered domain name appraisal platform serving the US aftermarket. Our valuations are built for English-language domains and the buyers and sellers who trade them.